

Anyone who has done grocery shopping, or any shopping really, over the last year has probably noticed the increase prices on, well, everything.
No, it is not your imagination. What we’re seeing across a lot of industries is a soaring increase of prices in raw materials. And it’s not just in the U.S., raw material prices are rising across the globe.
Some talk has been kicked up about ‘when will the housing bubble crash?’ as people see housing prices soar as well. But what we’re seeing this time isn’t so much a replay of the 2008 housing bubble crash where lenders were cooking their books within the derivates market and reselling bad debit, but more of a function of raw materials that goes into building new housing. The consequences of which, not only is building new soaring, but creating a bubble within a bubble of sorts on resell prices soaring as well.
For example, CEO Stinson Dean of Deacon Lumber, a lumber commodities trader, explains contributing factors to the rising costs of building from the lens of the different effects and reasons that can go, and are going, into one raw material used in building: lumber.
Backwardation, which is when the current price of an underlying asset is higher than prices trading in the futures market. It can also occur as a result of a higher demand for an asset currently than the contracts maturing in the coming months through the futures market.
In other words, backwardation is an indicator that tends to point to the volatility going on.
Add in extenuating circumstances, such as tariff wars, droughts, floods, extreme ice storms and freezing, shipping line disruptions due to weather, ships getting suck in canals, and COVID-19 which can all add to the volatility of commodities markets.
Now extrapolate that onto our food commodities.
There are a small handful of commodities, corn, wheat, soybean, and vegetable oils, that form the backbone of the world’s diet, and they are “dramatically more expensive, flashing alarm signals for global shopping budgets,” according to a recent Bloomberg article.
This week, the Bloomberg Agriculture Spot Index — which tracks key farm products — surged the most in almost nine years, driven by a rally in crop futures. With global food prices already at the highest since mid-2014, this latest jump is being closely watched because staple crops are a ubiquitous influence on grocery shelves — from bread and pizza dough to meat and even soda.
Soaring raw material prices have broad repercussions for households and businesses, and threaten a world economy trying to recover from the damage of the coronavirus pandemic. They help fuel food inflation, bringing more pain for families that are already grappling with financial pressure from the loss of jobs or incomes. For central banks, a spike in prices at a time of weak growth creates an unwelcome policy choice and could limit their ability to loosen policy.
“There seems to be sort of a bullish force behind the prices internationally,” Abdolreza Abbassian, senior economist at the United Nations’ Food and Agriculture Organization, said in an interview. “The indications are that there is very little reason to believe prices would remain at these levels. It’s more likely they will rise further. Hardship is still ahead.”
Bloomberg
According to a recent article published in early April from the U.N.’s Food and Agriculture Organization (FAO) , rises in the global food commodity prices in March marked the 10th consecutive month for global food prices.
Food prices refer to the average price of particular food commodities globally and across countries. (Max Roser and Hannah Ritchie (2013) – “Food Prices”. Published online at OurWorldInData.org.)
“The price of goods not only provide an important indicator of the balance between agricultural production and market demand, but also have strong impacts on food affordability and income…Food markets can therefore have a strong impact on food affordability, hunger and undernourishment and dietary quality.
Roser and Ritchie have taken an historical view on food prices dating back to, in some cases, the 13th century; compares food prices to wages; consequence of volatility; per capita food expenditures; and food vs energy prices.
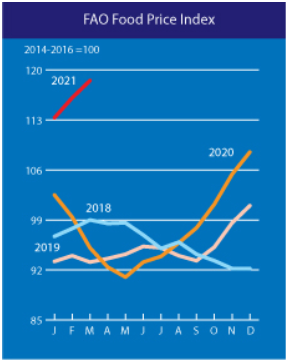
The FAO defines the FAO Food Price Index (FFPI) as “a measure of the monthly change in international prices of a basket of food commodities.” The FFPI consists of “the average of five commodity group price indices weighted by the average export shares of each of the groups over 2014-2016.”
The FAO Food Price Index (FFPI) averaged 118.5 points in March 2021, 2.4 points (2.1 percent) higher than in February. The increase marked the tenth consecutive monthly rise in the value of the FFPI to its highest level since June 2014. The increase was led by strong gains in vegetable oils, meat and dairy sub-indices, while those of cereals and sugar subsided.
FAO Food Price Index
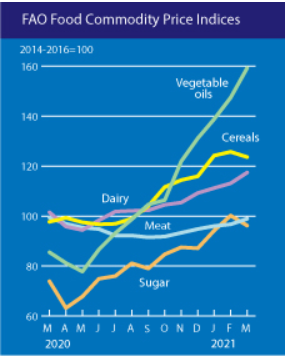
Trends varied by commodity types. The March increase was led by the FAO Vegetable Oil Price Index, which rose 8.0 percent from the previous month to hit a nearly 10-year high, with soy oil prices rising sharply due in part to the prospects of firm demand from the biodiesel sector.
The FAO Dairy Price Index increased 3.9 percent from February, with butter prices buoyed by somewhat tight supplies in Europe associated with increased demand in anticipation of a food-service sector recovery. Milk powder prices also rose, supported by a surge in imports in Asia, particularly China, due to declining production in Oceania and scarce shipping container availability in Europe and North America.
The FAO Meat Price Index also rose, by 2.3 percent from February, with imports by China and a surge in internal sales in Europe ahead of the Easter holiday celebration underpinning increasing poultry and pig meat quotations. Bovine meat prices remained steady, while ovine meat prices declined as dry weather in New Zealand led to farmers offloading animals.
By contrast, the FAO Cereal Price Index dropped by 1.8 percent, but it is still 26.5 percent higher than in March 2020. Wheat export prices declined the most, reflecting generally good supplies and favourable production prospects for 2021 crops. Maize and rice prices also declined, while those for sorghum rose.
The FAO Sugar Price Index declined 4.0 percent in the month, triggered by prospects of large exports from India, but it remained more than 30 percent above its year-earlier level.
FAO Food Price Index
As Dean suggests about the lumber market being in “the most bullish market you can have” with no correction any time soon, food price indicators are telling us the same thing: all signs are pointing to it is likely to get a lot worse before it gets better.