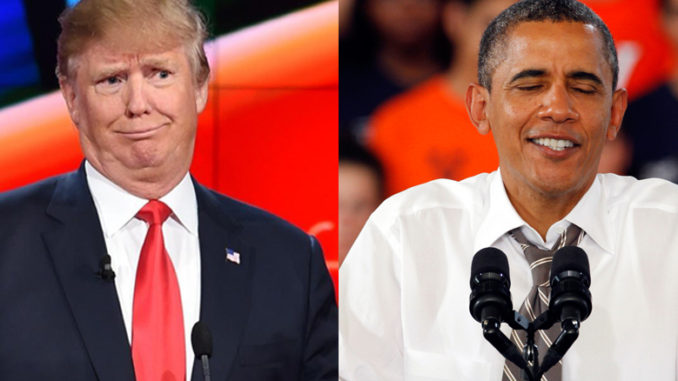
“Nobody can beat me on the economy (and jobs)…,” Republican Presidential candidate Donald Trump proclaimed on April 20, 2016. Since his election, the economy has been expanding and the unemployment rate has been falling. On November 26, 2017, President Trump tweeted, “…I have the economy booming…” On January 14, 2018, he complained, “President Trump is not getting the credit he deserves for the economy… All Trump, not O.” “O,” of course, refers to his predecessor, President Barack Obama.
Is President Trump right? Does he deserve all the credit for the economy’s growth and the job creation that has been occurring?
The ongoing economic expansion predates the Trump Presidency. From January 2009 when President Obama took office to January 2017 when he completed his Presidency, civilian employment rose by 9.924 million. Since that time, civilian employment rose an additional 3.105 million. Those figures imply that Obama, not Trump, is responsible for 76% of the increase in civilian employment that has occurred during the current economic expansion.
What about total nonfarm payroll? During President Obama’s tenure, total nonfarm payroll increased by 11.641 million persons. During President Trump’s Administration, it has risen by another 2.728 million persons. This data implies that President Obama would deserve credit for 81% of increase in nonfarm payroll employment that has taken place.
But is this really the right way to proceed?
Those backing the former President can point to developments such as the 2009 fiscal stimulus legislation to make their case. Those supporting the current President can argue that regulatory changes and the early stimulus from the 2017 tax law changes are responsible. Others can highlight the long-enduring, extraordinarily accommodative monetary policy pursued by the Federal Reserve. All of those assertions have a degree of merit, as fiscal, monetary, tax, and regulatory policy all impact the economy.
However, one can also build a strong case that the markets are largely responsible. One can do so by looking back to the past when the business cycle reached an equivalent stage to that of the current expansion. So long as the structural realities underpinning the economy are not very dissimilar between the two cases, the argument for markets can be persuasive.
The current economic expansion is now the second longest on record. That allows for a comparison with the economic expansion that began in March 1991. Today’s economy is moderately, but not radically different from that of the 1991-2001 expansion. So, how do the numbers stack up when each expansion stood at 106 months?
March 1991-March 2001 Expansion:
• Unemployment rate (U-3): 4.0%; 12-month average: 4.2%
• Unemployment + Marginally Attached Workers + Employed Part-time for Economic Reasons (U-6): 7.1%; 12-month average: 7.4%
• Adjusted Unemployment Rate to include people outside the labor force who want jobs: 6.8%
Current Expansion:
• Unemployment rate (U-3): 3.9%; 12-month average: 4.2%
• Unemployment + Marginally Attached Workers + Employed Part-time for Economic Reasons (U-6): 7.8%; 12-month average: 8.2%
• Adjusted Unemployment Rate to include people outside the labor force who want jobs: 6.9%
There is one notable difference in outcomes: the nation’s annual fiscal balance. During the earlier economic expansion, the nation’s fiscal balance registered a positive swing of 6.7% of GDP. The nation’s budget deficit started at $269.2 billion or 4.4% of GDP. In fiscal year 2000, that deficit had disappeared completely. The nation had a surplus of $236.2 billion or 2.3% of GDP.
When the most recent recession ended, the nation had a budget deficit of $1.413 trillion or 9.8% of GDP. The Congressional Budget Office (CBO) projects a budget deficit of $804 billion (4.2% of GDP) for the current fiscal year, implying a positive swing of 5.6% of GDP since the end of the Great Recession.
However, while the budget surplus was peaking at this point during the prior economic expansion, the budget deficit bottomed out a few years earlier during fiscal year 2015. This reversal suggests that structural dynamics are beginning to supplant cyclical ones as the dominant factor influencing yearly fiscal deficits. This development has long been predicted by the IMF and CBO based on a combination of the demographic change underway in the United States, the U.S. tax code, and its mandatory spending obligations.
Back to the central issue, perhaps France’s last Queen, Marie Antoinette, had it right when she observed, “There is nothing new except what has been forgotten.” The data show that the economy was “here” before—in January 2000—with strikingly similar employment outcomes.
This similarity of outcomes argues that the current labor market strength may be more a tale of markets than Presidents, politicians, or politics. That won’t stop the President or politicians from claiming credit with the approach of the mid-term elections. The politicians seeking most or all of the credit are counting on the prospect that the past has been forgotten.

1 Trackback / Pingback
Comments are closed.